Unsupervised Learning
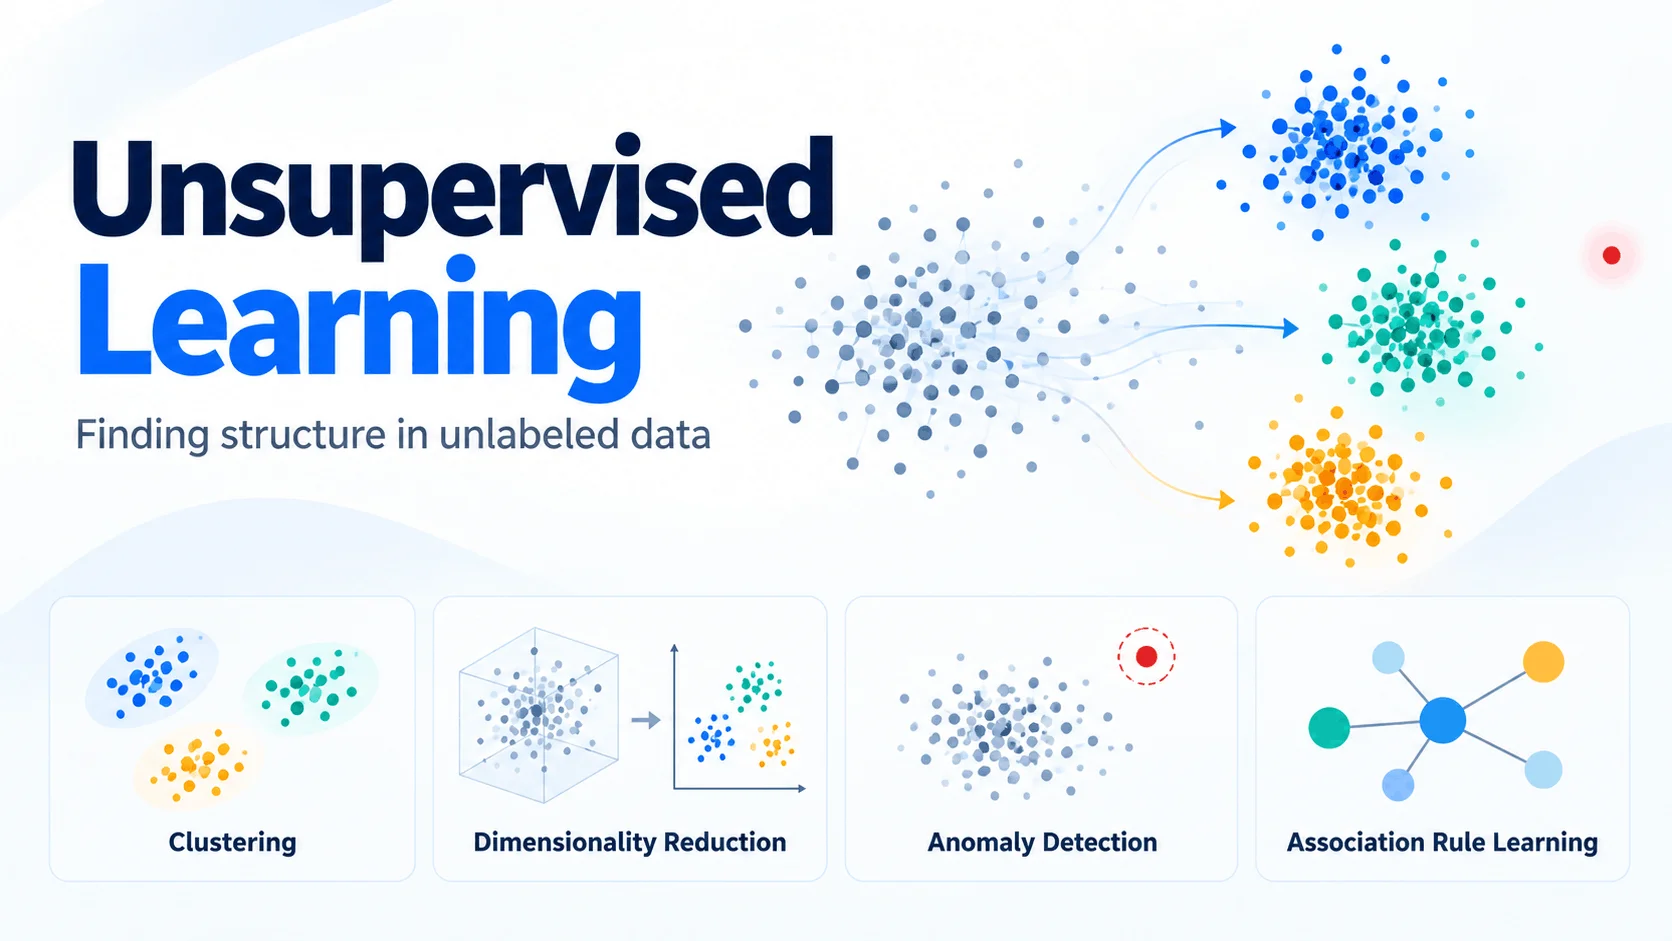
Unsupervised learning is a machine learning approach in which a model finds patterns in data that has no labels. Nobody tells the algorithm what the “right answer” is. It looks for structure on its own: natural groups, unusual points, items that occur together, or simpler ways to describe complex data.
Most real-world data is unlabeled, which is why this approach matters. This guide explains how unsupervised learning works, the main families of techniques, the most common algorithms, how to judge results when there is no answer key, and when to choose it over other approaches.
Unsupervised Learning in Brief
- What it needs: only input data (features), with no target column.
- What it produces: groups, low-dimensional representations, anomaly scores, or association rules.
- Typical goal: exploration and discovery, not prediction of a known outcome.
- How you judge it: through internal metrics, stability checks, and, most importantly, whether the results make sense and are useful to a domain expert.
- Main weakness: with no ground truth, it is harder to know whether the output is “correct.”
How Unsupervised Learning Works
A supervised model is trained to reduce the gap between its predictions and known answers. An unsupervised model has no such answers, so it optimizes an internal objective instead. The objective depends on the technique:
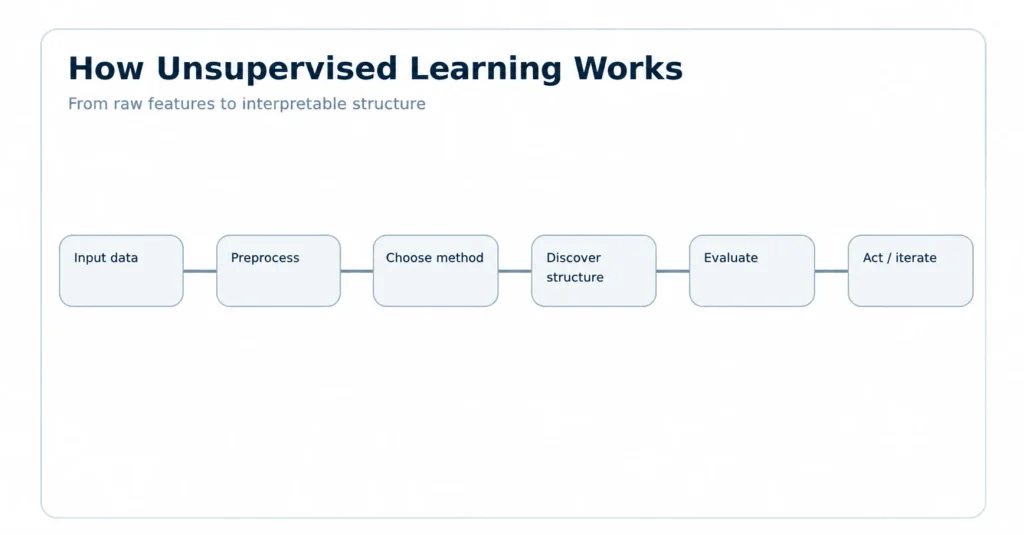
- A clustering algorithm tries to make points in the same group similar to each other and different from other groups.
- A dimensionality reduction method tries to preserve as much important information (variance, distances, or neighborhood structure) as possible in fewer variables.
- An anomaly detector learns what “normal” looks like and scores how far each point departs from it.
- An association method counts how often items appear together and keeps the combinations that occur more than chance would suggest.
Because the algorithm decides what counts as a pattern, your choices matter a lot: which features you include, how you scale them, and how you measure similarity all shape the result.
The Main Types of Unsupervised Learning
Here are the main types of unsupervised learning; let’s discuss them in detail.
Clustering
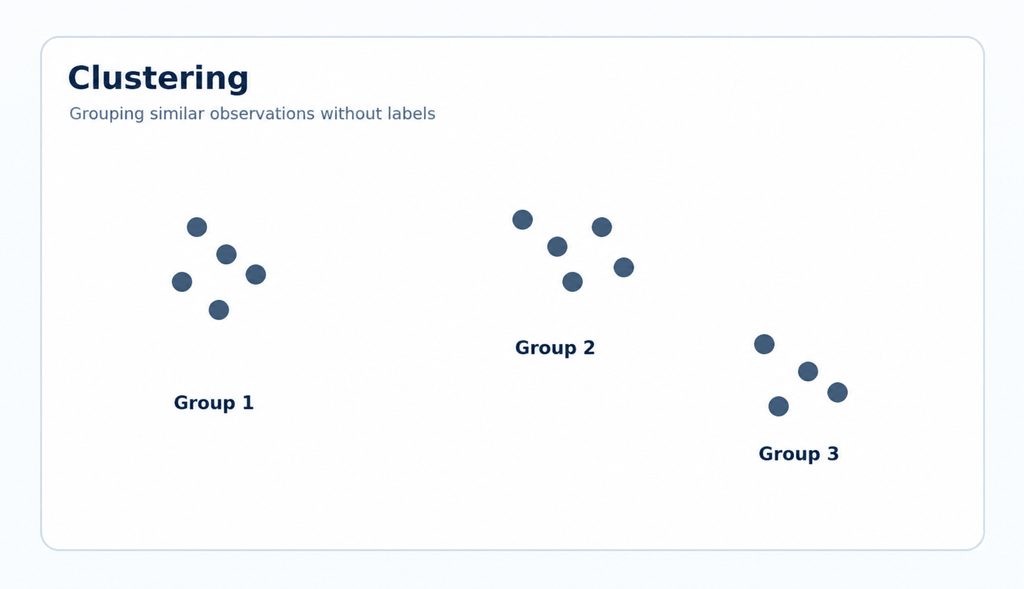
Clustering groups similar data points together. It is useful when you suspect your data contains sub-populations but do not know what they are, such as customers with different buying habits or patients who respond differently to a treatment.
Common algorithms:
- K-means splits data into a chosen number (k) of groups around centers. It is fast and simple, but you must pick k, and it works best on roughly round, similarly sized clusters.
- Hierarchical clustering builds a tree of nested groups, so you can view the data at different levels of granularity. It is easier to interpret on small datasets but scales poorly to very large ones.
- DBSCAN groups points by density. It can find clusters of irregular shape and labels sparse points as noise, and it does not require you to set the number of clusters. It can struggle when clusters have very different densities.
- Gaussian mixture models treat data as coming from several overlapping bell-shaped distributions and give each point a probability of belonging to each group (soft clustering).
Dimensionality Reduction
Dimensionality reduction compresses many variables into fewer while keeping the important structure. It helps with visualization, noise reduction, faster downstream modeling, and coping with datasets that have far more features than examples.
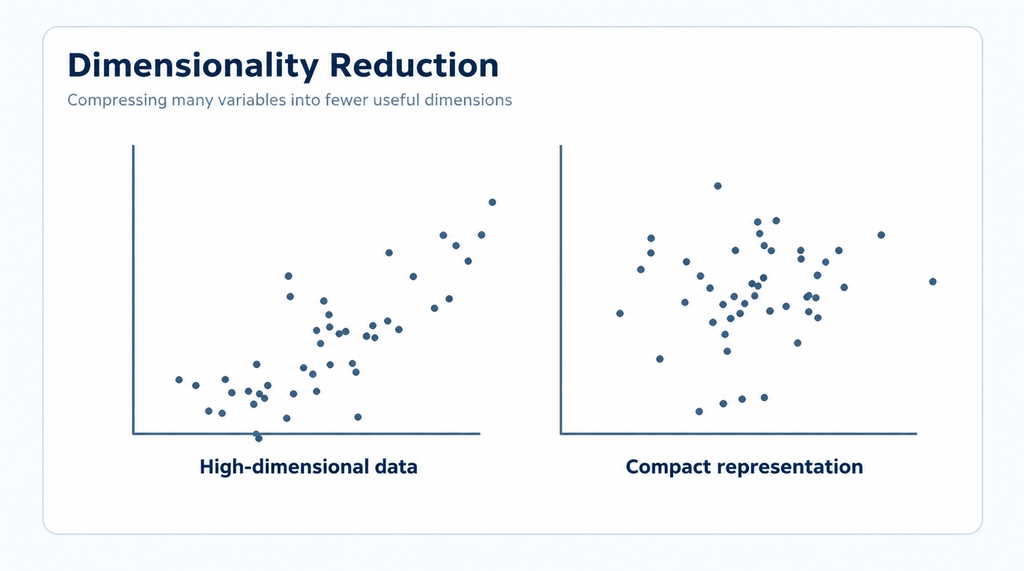
- Principal component analysis (PCA) creates new variables (components) that capture the most variance using linear combinations of the originals. It is a standard first step for compression and preprocessing.
- t-SNE and UMAP are non-linear methods used mainly to visualize high-dimensional data in two or three dimensions. They are good at revealing local groupings, but distances between separate clusters in the plot should not be over-interpreted, and results depend on settings.
- Autoencoders are neural networks that compress data into a compact representation and then reconstruct it. They can capture non-linear structure.
Anomaly Detection
Anomaly (or outlier) detection defines normal behavior and flags what does not fit. Typical methods include Isolation Forest, Local Outlier Factor (LOF), one-class SVM, and reconstruction error from autoencoders.
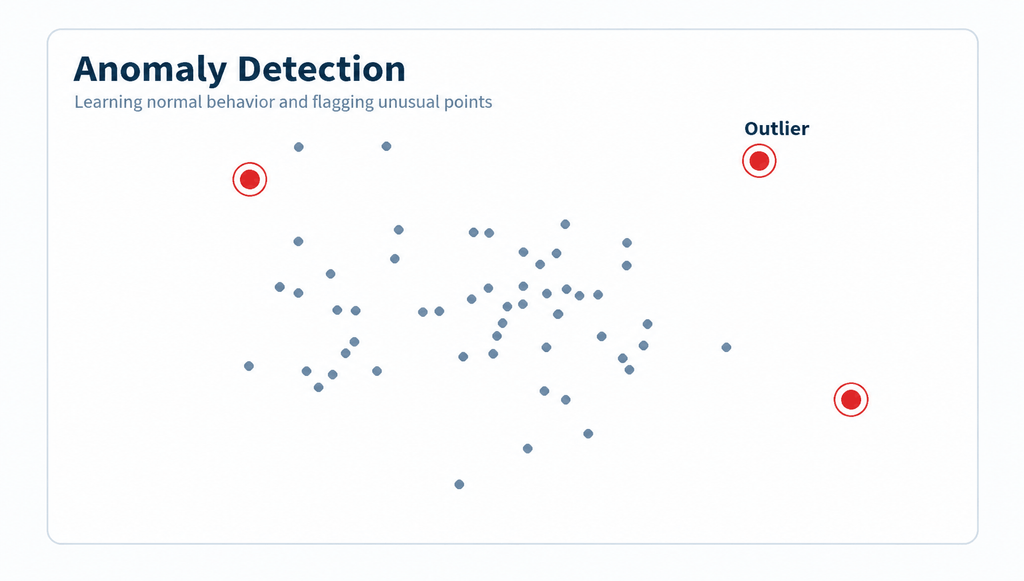
It is often called unsupervised because it needs no labeled anomalies, though in practice teams frequently validate and tune it with a small set of known cases.
Association Rule Learning
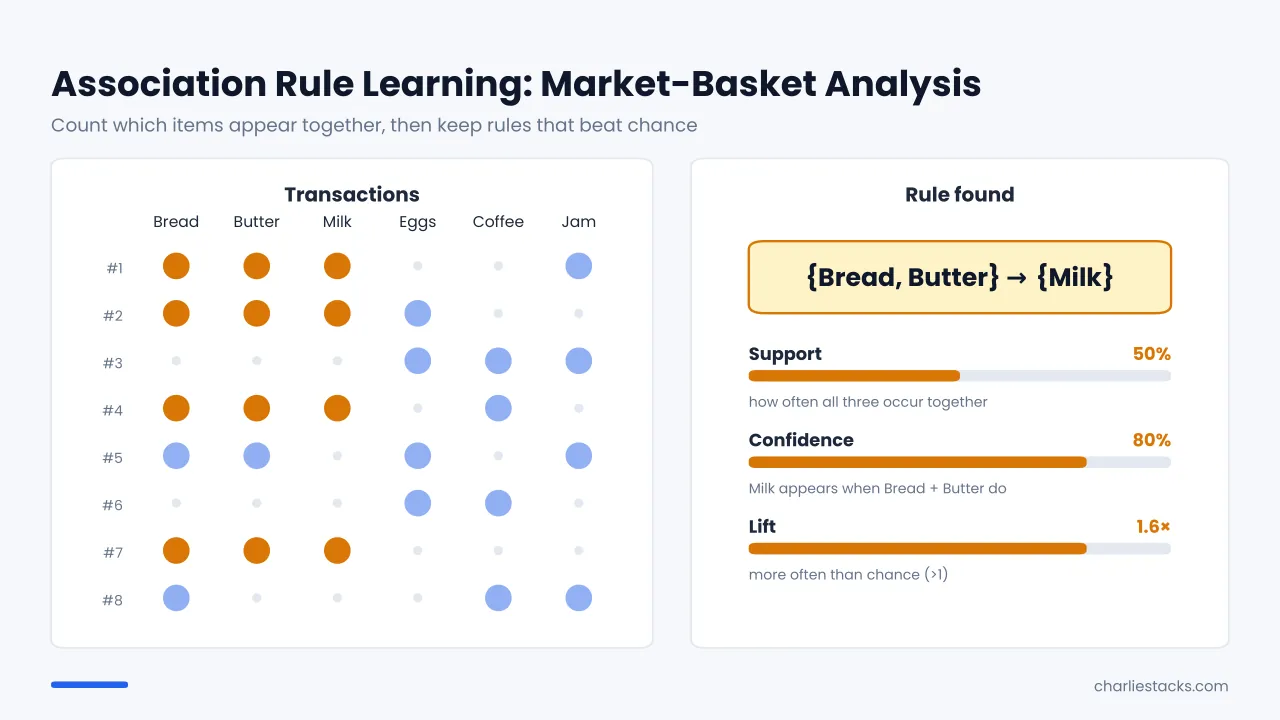
Association rule mining finds items that tend to appear together, the basis of “customers who bought this also bought that.” Apriori, Eclat, and FP-Growth are classic algorithms. Rules are judged by measures such as support (how often the combination occurs), confidence (how often the second item appears when the first does), and lift (how much more often than chance).
Real-World Applications
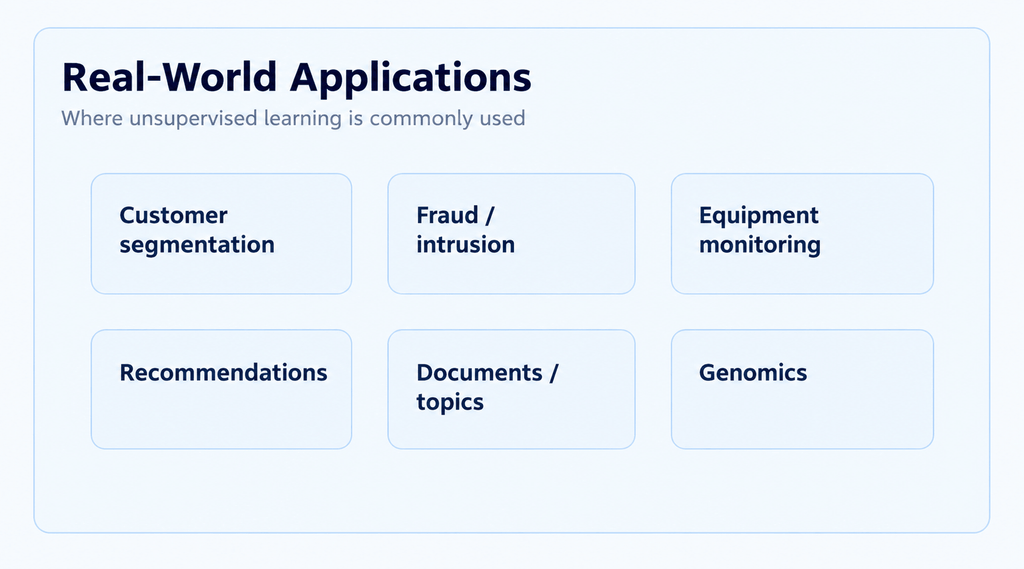
- Customer segmentation: grouping customers by behavior to tailor marketing, pricing, or service.
- Fraud and intrusion detection: flagging transactions or network activity that deviate from normal.
- Equipment monitoring: spotting sensor readings that signal a failing machine.
- Recommendation and market-basket analysis: finding products or content that go together.
- Document and topic organization: grouping articles or support tickets by theme (topic modeling).
- Scientific research: discovering subgroups in medical studies, identifying rare events in astronomy, or grouping related archaeological sites.
- Data preparation: reducing dimensions, detecting bad records, and compressing images or signals before other modeling.
- Genomics: grouping genes or samples with similar expression patterns.
How to Evaluate Unsupervised Learning Results
With no labels, evaluation is partly numerical and partly judgment.
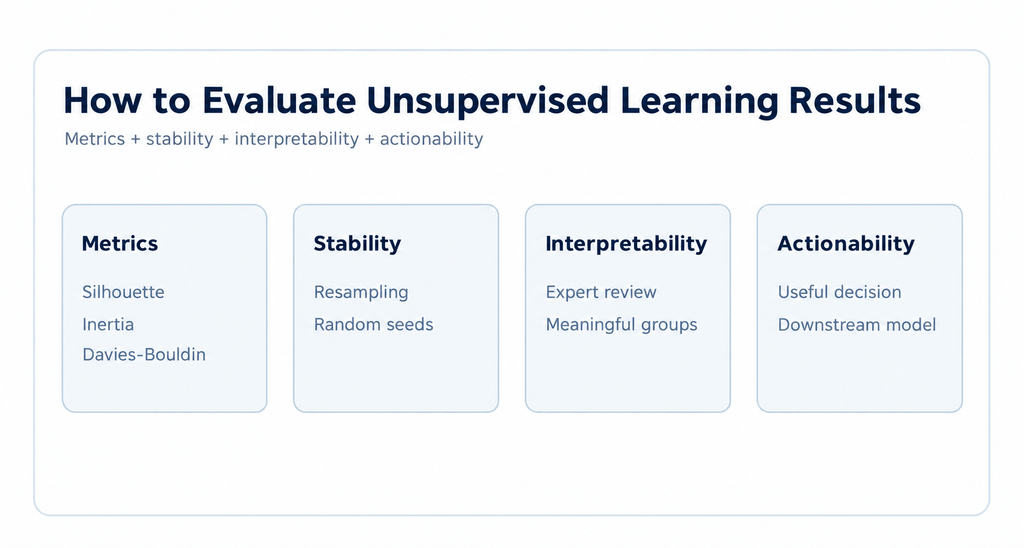
Internal metrics (using only the data and the result)
- Silhouette score: how well each point fits its own cluster compared with the nearest other one. Values range from -1 to 1, with higher generally better.
- Inertia / within-cluster sum of squares: used with the “elbow” method to choose k for k-means.
- Davies–Bouldin index: lower values indicate more separated, compact clusters.
- Explained variance: for PCA, how much of the original variation the retained components capture.
- Reconstruction error: for autoencoders and PCA, how well compressed data can be rebuilt.
External checks (when some ground truth exists)
- Metrics such as the adjusted Rand index compare clusters against known groups, if you happen to have them for a subset.
Practical validation
- Stability: do you get similar clusters when you resample the data or change the random seed?
- Interpretability: can a domain expert describe what each group represents?
- Actionability: Does the result lead to a decision or a better downstream model? A statistically neat clustering that suggests no action is of limited value.
Treat good metric scores as necessary but not sufficient. They measure mathematical tidiness, not business meaning.
Common Pitfalls
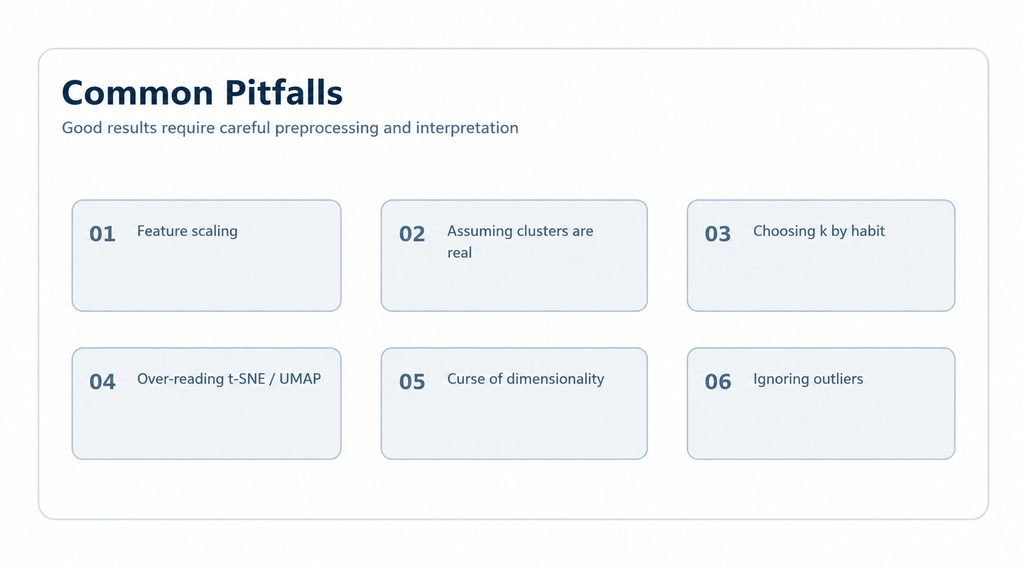
- Forgetting to scale features. Distance-based methods (k-means, DBSCAN, hierarchical clustering, and PCA) are dominated by variables with large numeric ranges unless you standardize them.
- Assuming clusters are “real.” Every algorithm returns groups, even from random data. Confirm that they are stable and meaningful.
- Choosing k by habit. Try several values and combine metrics with domain knowledge.
- Over-reading t-SNE and UMAP plots. They are visualization aids, and their cluster sizes and inter-cluster distances can be misleading.
- The curse of dimensionality. In very high dimensions, distances become less informative. Reduce dimensions or select features first.
- Mixed data types. Standard distance measures assume numeric data. Categorical variables need suitable encodings or methods designed for mixed data.
- Ignoring outliers. K-means and PCA are sensitive to extreme values, which can distort centers and components.
Unsupervised vs. Supervised vs. Semi-Supervised vs. Self-Supervised Learning
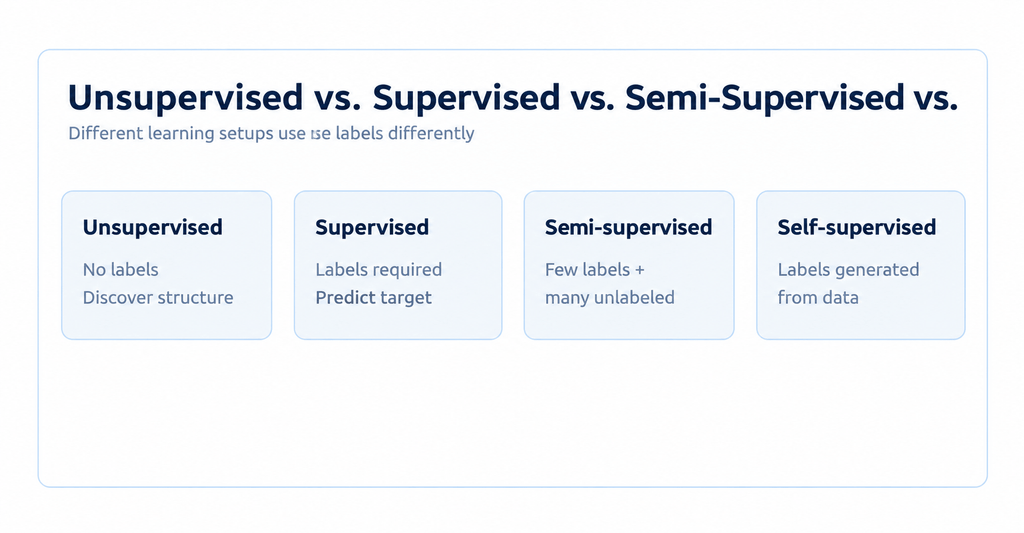
| Unsupervised | Supervised | Semi-supervised | Self-supervised | |
| Labels | None | Required for all data | Few labeled, many unlabeled | Generated automatically from the data |
| Typical goal | Discover structure. | Predict a known target. | Predict with less labeling. | Learn general representations. |
| Example | Customer segmentation | Spam detection | Medical image classification | Pretraining a language model |
The boundaries are not rigid. Some sources treat self-supervised learning as a subtype of unsupervised learning, since it uses no human labels, while others list it separately because its training resembles supervised learning. Unsupervised methods are also frequently used as a stage in larger pipelines, for example clustering to explore data or PCA to compress features before a supervised model.
Advantages and Limitations
Let’s discuss the advantages and limitations of unsupervised learning.
Advantages
- Works with unlabeled data, which is abundant and cheap compared with labeled data.
- Can reveal patterns and groupings you did not know to look for.
- Useful for exploration, preprocessing, and generating hypotheses.
- Helps simplify and visualize complex data.
Limitations
- No definitive measure of correctness, so results need interpretation.
- Sensitive to preprocessing, distance measures, and parameter choices.
- Discovered structure may not align with what you actually care about.
- Results can be hard to explain to non-technical stakeholders.
- Findings show patterns, not causes.
When to Use Unsupervised Learning
Choose it when:
- You have data but no labeled outcome or no clear target to predict.
- Your aim is to explore, segment, compress, or find unusual cases.
- You want to simplify data before further modeling.
- Labeling would be too expensive or impractical.
If you do have labeled outcomes and a clear prediction goal, supervised learning is usually the more direct route. If you have a few labels and many unlabeled examples, consider semi-supervised learning. If the task involves sequential decisions with rewards, look at reinforcement learning.
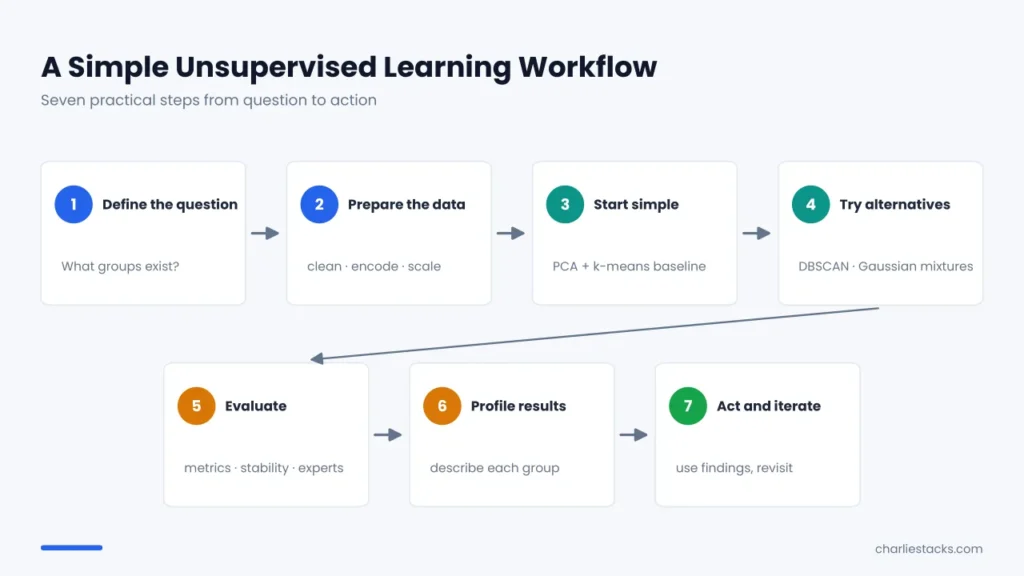
A Simple Workflow to Get Started
- Define the question. “What natural groups exist among our customers?” is better than “run clustering.”
- Prepare the data. Handle missing values, encode categories, and scale numeric features.
- Start simple. Try PCA to understand the data’s shape and k-means or hierarchical clustering as a baseline.
- Try alternatives. Compare methods such as DBSCAN or Gaussian mixtures if clusters are irregular.
- Evaluate on several fronts. Use internal metrics, stability tests, and expert review.
- Profile the results. Summarize what distinguishes each cluster or component in plain language.
- Act and iterate. Use the findings, then revisit when data or goals change.
In Python, scikit-learn provides implementations of the algorithms mentioned here, including k-means, DBSCAN, hierarchical clustering, Gaussian mixtures, PCA, and Isolation Forest.
Frequently Asked Questions
What is unsupervised learning in simple terms?
It is letting a computer explore data without giving it answers. The algorithm looks for groups, patterns, or oddities on its own.
What is an example of unsupervised learning?
Grouping online shoppers into segments based on their browsing and purchase behavior, without telling the algorithm what the segments should be.
What are the main types of unsupervised learning?
Clustering, dimensionality reduction, anomaly detection, and association rule learning.
What is the difference between supervised and unsupervised learning?
Supervised learning learns from labeled examples to predict a known outcome. Unsupervised learning works without labels and aims to uncover structure.
Is clustering the same as classification?
No. Classification assigns items to predefined categories learned from labeled examples. Clustering discovers the groups itself, and the groups have no names until a person interprets them.
Is PCA unsupervised?
Yes. PCA uses only the input features, with no target variable, to find directions of greatest variance.
How do I choose the number of clusters?
There is no universal rule. Common approaches include the elbow method, silhouette scores, and other metrics, but the best check is whether the resulting clusters are stable and useful. Density-based methods like DBSCAN avoid the need to pick a number in advance.
How do you know if an unsupervised model is good?
Combine internal metrics, stability tests, and expert judgment. A model is good if its output is consistent, interpretable, and helps with a real decision or downstream task.
Can unsupervised learning be used for prediction?
Not directly, since there is no target. But its outputs can feed predictions, for example cluster membership or compressed features used as inputs to a supervised model.
Is anomaly detection supervised or unsupervised?
It can be either. Approaches like Isolation Forest and LOF are unsupervised, while methods trained on labeled examples of normal and abnormal cases are supervised. Many real systems are hybrids.
Is deep learning unsupervised?
Deep learning is a family of neural network methods that can be used in supervised, unsupervised, self-supervised, and reinforcement settings. Autoencoders are a common unsupervised deep learning example.
Key Takeaways
- Unsupervised learning finds structure in unlabeled data, with no answer key.
- Its four main families are clustering, dimensionality reduction, anomaly detection, and association rule learning.
- Preprocessing (especially scaling) and the choice of method strongly shape results.
- Evaluate by combining metrics, stability, and human interpretation, since no single score proves the patterns are meaningful.
- Use it to explore, segment, compress, and detect the unusual. When a labeled prediction target exists, supervised learning is usually the better fit.