Supervised Learning
Supervised learning is a machine learning approach in which a model learns from examples that already include the correct answer. Each training example pairs an input (an email, a photo, or a row of customer data) with a label (spam, “golden retriever,” or $412,000). The model studies many of these pairs, learns the relationship between inputs and outputs, and then predicts the output for new inputs it has never seen.
This guide explains how supervised learning works, the two problem types it solves, the main algorithms, how models are evaluated, and where it goes wrong.
Supervised Learning in Brief
- What it needs: labeled training data.
- What it produces: a model that predicts a category (classification) or a number (regression).
- How you know it works: you test it on labeled data it did not train on and compare its predictions to the known answers.
- Best suited to: problems where you have historical examples of the outcome you want to predict.
- Main weakness: it depends on the quantity and quality of labeled data, and labeling can be expensive.
How Supervised Learning Works
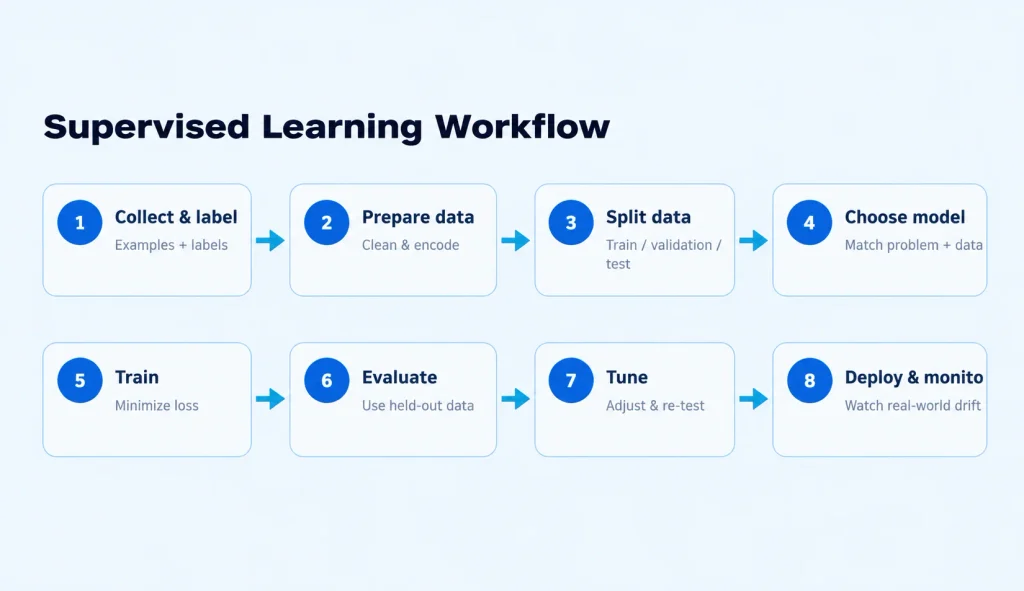
The workflow is similar whatever the algorithm.
- Collect and label data. Gather examples and attach the correct outcome to each. The inputs are called features; the outcome is the label or target.
- Prepare the data. Clean errors, handle missing values, encode categories as numbers, and scale features where the algorithm requires it.
- Split the data. Set aside portions for training, validation (for tuning choices), and testing (for a final, unbiased check). A common split is roughly 70/15/15 or 80/20, but the right ratio depends on how much data you have.
- Choose a model. Pick an algorithm suited to the problem type and data.
- Train. The algorithm adjusts its internal parameters to reduce a loss function, a numerical measure of how far its predictions are from the true labels.
- Evaluate. Measure performance on the held-out data using appropriate metrics.
- Tune and iterate. Adjust hyperparameters, features, or the model itself, then re-evaluate.
- Deploy and monitor. Use the model on new data and watch for performance dropping as real-world data changes.
The central idea is generalization: the goal is not to memorize the training examples but to perform well on new ones.
Visual: The supervised learning workflow from labeled data to deployment.
Types of Supervised Learning Problems
Classification
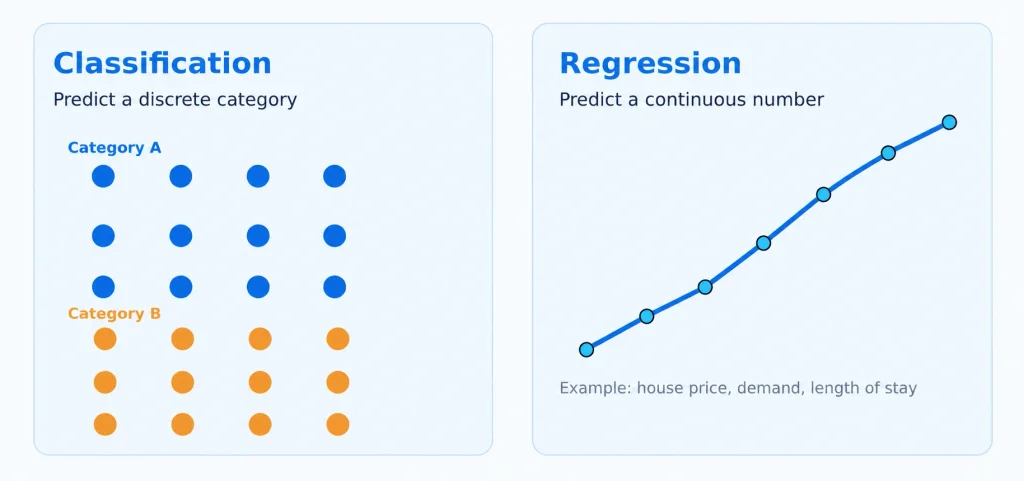
Classification predicts a discrete category.
- Binary classification: two outcomes, such as fraud vs. not fraud.
- Multiclass classification: one of several categories, such as identifying a handwritten digit from 0 to 9.
- Multilabel classification: several labels can apply at once, such as tagging a photo as “beach,” “sunset,” and “people.”
Models often output a probability (for instance, 0.87 chance of spam), and a threshold converts that into a decision.
Visual: Classification predicts categories, while regression predicts numeric values.
Regression
Regression predicts a continuous number, such as a home’s sale price, next week’s demand for a product, or a patient’s length of hospital stay.
The line between the two is the output type, not the algorithm. Many algorithms have both a classification and a regression version. Note that “logistic regression,” despite its name, is a classification method.
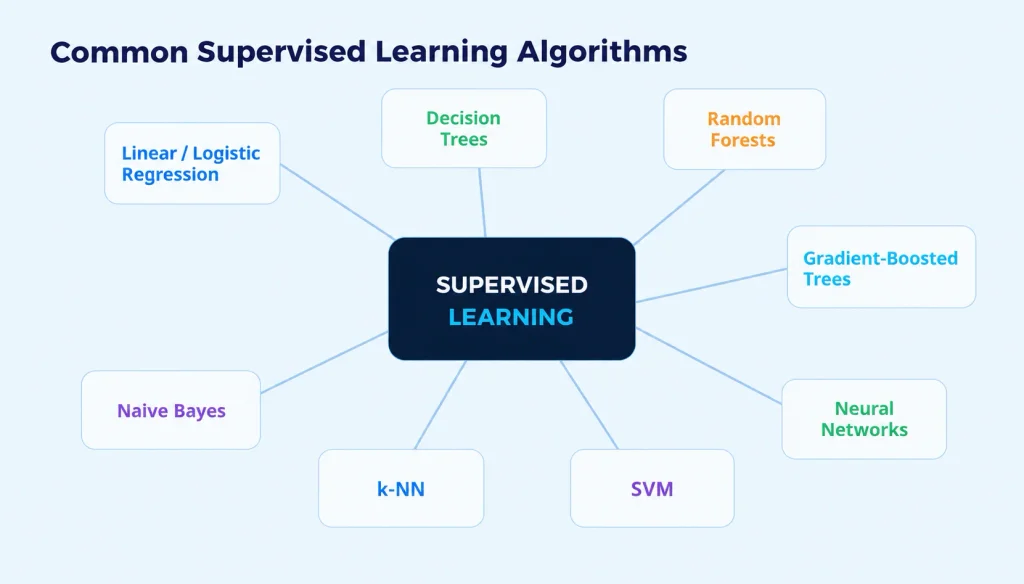
Common Supervised Learning Algorithms
| Algorithm | Used for | Strengths | Trade-offs |
| Linear regression | Regression | Simple, fast, easy to interpret | Assumes a linear relationship unless features are engineered |
| Logistic regression | Classification | Interpretable, gives probabilities, strong baseline | Limited with complex, non-linear patterns |
| Decision trees | Both | Intuitive, handles mixed data types, minimal preparation | Single trees overfit easily |
| Random forests | Both | Robust, accurate, less prone to overfitting than one tree | Less interpretable, larger models |
| Gradient-boosted trees | Both | Often the top performer on tabular data | More tuning needed, can overfit if careless |
| Support vector machines | Both | Effective in high-dimensional data | Slow on very large datasets, needs careful scaling and tuning |
| k-nearest neighbors | Both | No training step, simple concept | Slow at prediction time, sensitive to feature scaling |
| Naive Bayes | Classification | Fast, works well on text with little data | Assumes features are independent, which is rarely true |
| Neural networks | Both | Excel at images, audio, text, and other unstructured data | Need large data and compute, harder to interpret |
There is no single best algorithm. A widely used rule of thumb is to start with a simple baseline (linear or logistic regression) so you know what “better” means, then try tree-based ensembles for tabular data, and neural networks for images, audio, and text.
Real-World Applications
- Email filtering: classifying messages as spam or legitimate.
- Finance: credit scoring, fraud detection, and forecasting.
- Healthcare: classifying medical images or estimating risk from patient records, always as decision support and not a replacement for clinicians.
- Retail and marketing: predicting customer churn, demand, and likelihood to purchase.
- Computer vision: recognizing objects, faces, and defects on a production line.
- Language and speech: sentiment analysis, translation, and speech recognition.
- Real estate and insurance: price estimation and claims prediction.
Visual: Common algorithm families used for supervised learning.
How to Evaluate a Supervised Learning Model
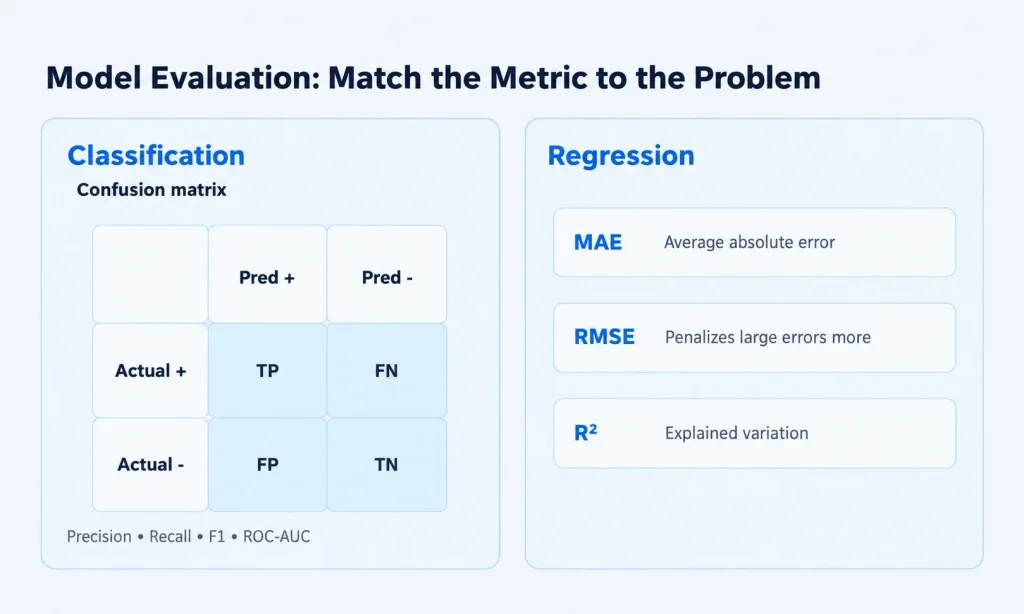
Accuracy alone can mislead. Suppose only 1% of transactions are fraudulent. A model that predicts “not fraud” every time is 99% accurate and completely useless. Choose metrics that match the problem.
Classification metrics
- Precision: of the items predicted positive, how many really were?
- Recall: of the truly positive items, how many did the model find?
- F1 score: a single number balancing precision and recall.
- ROC-AUC and precision-recall curves: performance across all decision thresholds.
- Confusion matrix: a breakdown of correct and incorrect predictions by class.
Which to prioritize depends on the cost of errors. In cancer screening, missing a case (low recall) is usually worse than a false alarm. In a system that automatically blocks accounts, false alarms (low precision) can be costly.
Regression metrics
- Mean absolute error (MAE): the average size of errors, in the target’s own units.
- Root mean squared error (RMSE): like MAE but penalizes large errors more heavily.
- R²: the share of variation in the target the model explains.
Cross-validation improves reliability by repeatedly training and testing on different splits of the data, which matters most when the dataset is small.
Overfitting, Underfitting, and the Bias–Variance Trade-Off
These are the most common reasons supervised models disappoint.
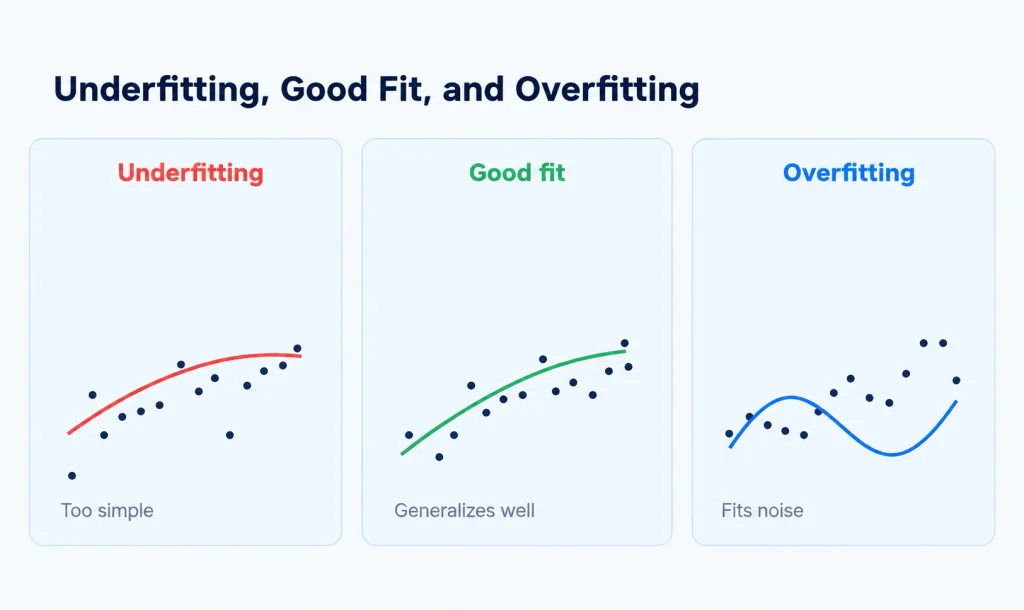
- Overfitting: the model learns noise and quirks of the training data, so it scores very well in training but poorly on new data. Sign: a large gap between training and test performance.
- Underfitting: the model is too simple to capture the real pattern, so it performs poorly everywhere.
These are two sides of the bias–variance trade-off. High-bias models are too rigid and underfit. High-variance models are too flexible and overfit. The goal is a level of complexity that generalizes best.
Ways to reduce overfitting:
- Get more (and more varied) training data.
- Simplify the model or reduce the number of features.
- Use regularization (such as L1 or L2 penalties), which discourages overly complex fits.
- Prune decision trees or limit their depth.
- Use early stopping when training neural networks.
- Use ensembles, which average many models.
- Validate with cross-validation rather than a single split.
Ways to reduce underfitting: use a more expressive model, add informative features, or reduce excessive regularization.
Visual: Underfitting, a good fit, and overfitting.
Common Pitfalls Beginners Miss
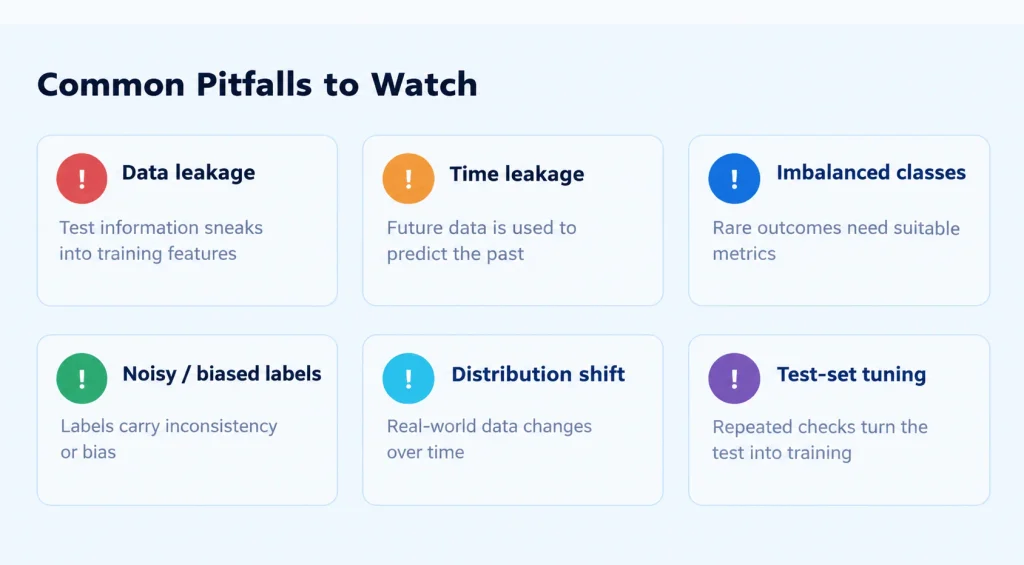
- Data leakage: information from outside the training context sneaks into the features, such as a column that is only known after the outcome occurs. The model looks brilliant in testing and fails in production. Always split data before any preprocessing that learns from it.
- Random splits on time-based data: if you’re forecasting, train on the past and test on the future. Shuffling lets the model “see” the future.
- Imbalanced classes: rare events need suitable metrics, and sometimes resampling or class weights.
- Noisy or biased labels: a model reproduces the patterns in its labels, including human inconsistency and bias. Better labels often beat a fancier algorithm.
- Distribution shift: a model trained on last year’s data may degrade when customer behavior or the environment changes.
- Tuning on the test set: repeatedly checking the test set to guide decisions quietly turns it into training data. Use a separate validation set.
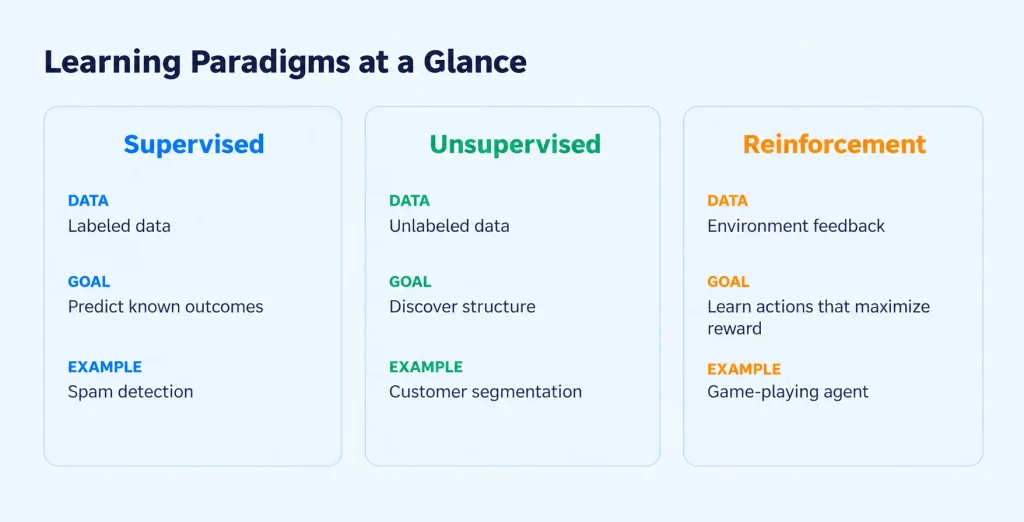
Supervised vs. Unsupervised vs. Reinforcement Learning
| <br> | Supervised | Unsupervised | Reinforcement |
| Data | Labeled | Unlabeled | Feedback from an environment |
| Goal | Predict known outcomes | Discover structure | Learn actions that maximize reward |
| Example | Spam detection | Customer segmentation | Game-playing agent |
Related approaches sit in between. Semi-supervised learning combines a small labeled set with a large unlabeled one, and self-supervised learning generates labels from the data itself, which is how many large language and vision models are pretrained before being fine-tuned with supervised methods.
Advantages and Limitations
Advantages
- Clear objective and straightforward evaluation against known answers.
- Strong performance when enough good labeled data exists.
- A mature ecosystem of algorithms and tools.
- Many models can be explained, which matters in regulated fields.
Limitations
- Labeling is costly and slow, and may require experts.
- Performance is capped by label quality.
- Models can fail on data unlike anything in training.
- It predicts patterns from the past and does not establish cause and effect.
When to Use Supervised Learning
Supervised learning is a good fit when all of the following hold:
- You can define a specific outcome to predict.
- You have, or can obtain, enough labeled examples of that outcome.
- The future data will resemble the training data.
- You can measure success with a sensible metric.
If you have data but no labels and want to explore it, look at unsupervised methods. If the problem involves sequential decisions with delayed feedback, consider reinforcement learning. If labels are scarce but unlabeled data is abundant, consider semi-supervised learning or fine-tuning a pretrained model.
Getting Started
For a first hands-on project, use a small, well-known tabular dataset and a library such as scikit-learn in Python. A sensible path is to train a simple baseline like logistic or linear regression, evaluate it on a held-out test set, compare it with a random forest or gradient-boosted model, and examine where each one makes mistakes. Understanding the errors teaches more than chasing the last fraction of accuracy.
Frequently Asked Questions
What is supervised learning in simple terms?
It is teaching a computer by example. You show it many inputs along with the correct answers, and it learns to produce the right answer for new inputs.
What are the two main types of supervised learning?
Classification, which predicts categories, and regression, which predicts numbers.
What is an example of supervised learning?
A spam filter trained on emails labeled “spam” or “not spam,” or a model that predicts house prices from size, location, and age using past sales.
What is the difference between supervised and unsupervised learning?
Supervised learning uses labeled data to predict a known target. Unsupervised learning uses unlabeled data to find patterns, such as clusters, without a target to predict.
Is linear regression supervised learning?
Yes. It learns from inputs paired with numeric target values and predicts numbers for new inputs.
Is deep learning supervised?
Deep learning is a family of neural network methods, not a learning type. It can be used for supervised tasks (such as image classification with labeled photos), as well as unsupervised, self-supervised, and reinforcement learning.
How much labeled data do I need?
It depends on the problem’s complexity, the number of features, the algorithm, and how noisy the data is. Simple models can work with hundreds or thousands of examples, while deep neural networks trained from scratch typically need far more. Fine-tuning a pretrained model can reduce that need considerably. Learning curves, which plot performance against training size, help you judge whether more data would help.
Which supervised learning algorithm is best?
None is universally best. Gradient-boosted trees and random forests are strong defaults for tabular data, and neural networks usually lead on images, audio, and text. Always compare against a simple baseline.
Why is my model accurate in training but poor on new data?
That pattern usually signals overfitting or data leakage in your evaluation setup. Check for a train/test gap, simplify or regularize the model, add data, and confirm that no information from the test set influenced training.
Can supervised learning be biased?
Yes. If the labels or the training data reflect historical bias or under-represent certain groups, the model can reproduce or amplify those patterns. Auditing performance across subgroups and reviewing how labels were created are important safeguards, especially in hiring, lending, and healthcare.
Key Takeaways
- Supervised learning trains models on labeled examples to predict outcomes for new data.
- Its two problem types are classification (categories) and regression (numbers).
- Success depends on data quality, sound evaluation with the right metrics, and controlling overfitting.
- Start simple, split your data carefully, and watch for leakage and distribution shift.
- Choose supervised learning when you have a clear target and enough reliable labels; otherwise consider unsupervised, semi-supervised, self-supervised, or reinforcement approaches.